
Factories, Warehouses & Business Parks.
TENURED.
52,383 caveats back to 1995, street-level rents, JTC's own supply pipeline — and the one number their own site doesn't surface: how much tenure is actually left on what's trading.
30% of volume, by tenure
Now showing — MUF
Every planning area with at least 5 transactions in the last 12 months, by property type. Thin-sample areas are dropped rather than shown with an invented number.
| Property type | B1 | B2 | Total |
|---|---|---|---|
| Business Park | — | — | 2,714,883 |
| Multiple-User Factory | 6,439,252 | 6,317,487 | 12,756,739 |
| Single-User Factory | 3,080,798 | 23,633,223 | 26,714,021 |
| Warehouse | 1,809,392 | 10,537,824 | 12,347,216 |
| Zoning | Pipeline sqm |
|---|---|
| Business 2 | 8,918,052 |
| Business 1 | 396,562 |
| Business Park | 1,692 |
B2 is 96% of everything coming — 396,561 sqm of new B1 against 8.9M sqm of B2. If anyone's advising on B1 specifically, the supply story is that it's effectively fixed while B2 keeps expanding.
All figures: median PSM, 12-month trailing, JTC caveat data. Business Park stays tab-disabled — under 5 transactions in every planning area, so no fabricated per-area split.
What's selling.
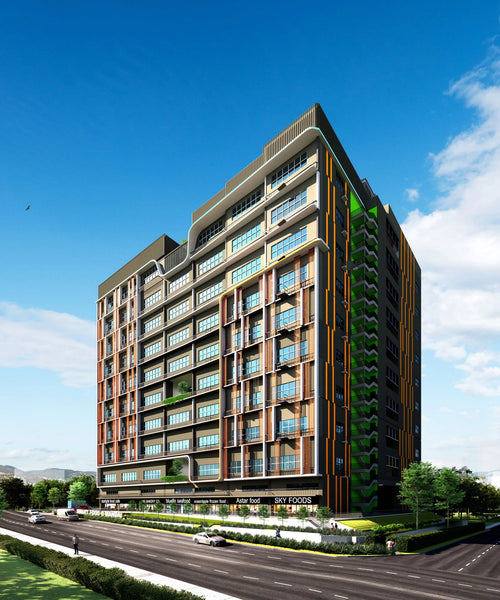
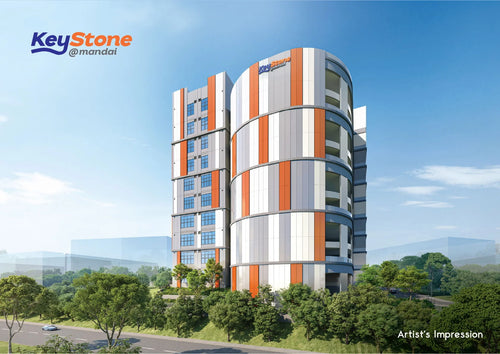
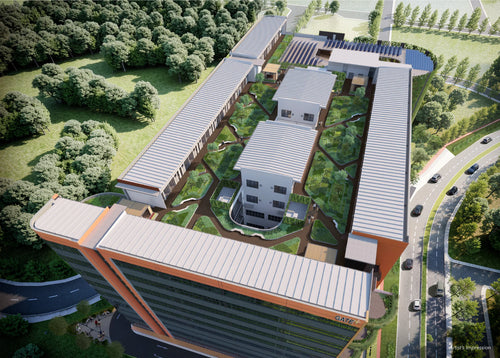
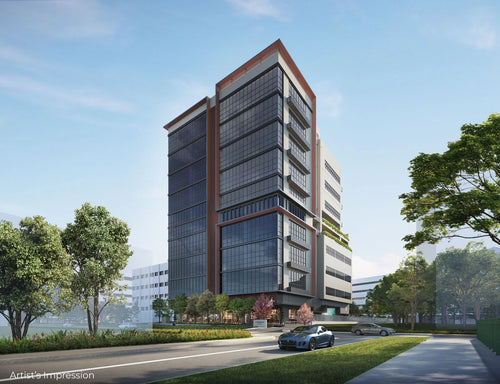
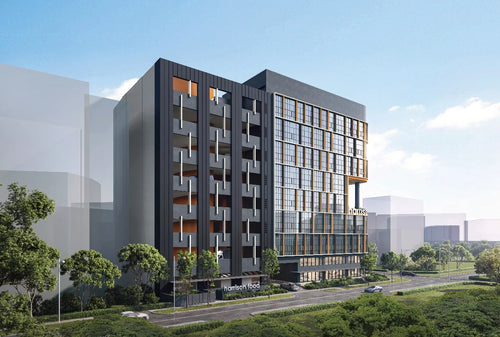
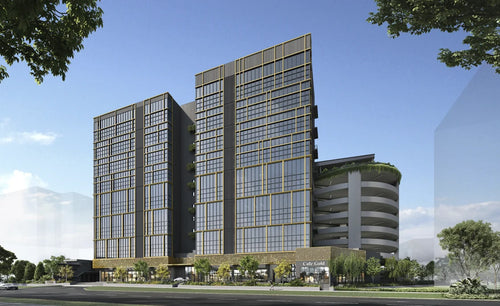
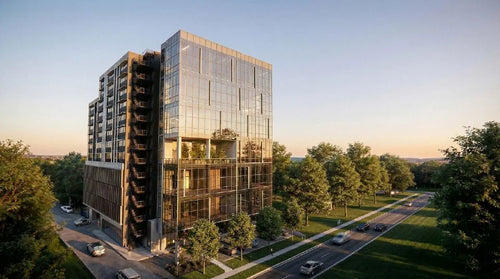
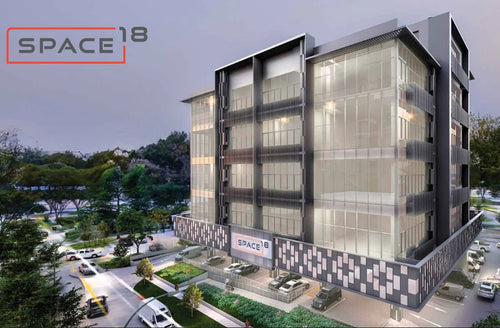
Industrial listings currently on the store. Zoning (B1/B2) is read from each product's tag where present, so a correction is a tag edit in Admin, not a template change.
Two projects, side by side.
Pick two projects to compare.
Only projects JTC tracks with a stated GFA appear here. There is no industrial product catalogue behind this yet, so the comparison is limited to pipeline attributes rather than unit-level specifications.
Four property types, two tenure structures.
Strata-titled units within a shared building — the industrial equivalent of a condo unit. The most liquid segment by a wide margin, and the one most retail investors are actually buying.
Whole-building or whole-land purchases, typically by the occupying company. Far fewer transactions at far higher quantum — a median around $7.2M against MUF's $956k.
Office-grade space zoned for R&D, tech and back-office use — a hybrid between industrial and commercial, at industrial-grade rents. Almost never transacts: two caveats island-wide in the last twelve months.
Storage and distribution space, dominated by B2 zoning and increasingly driven by e-commerce fulfilment rather than manufacturing.
Strata (MUF) vs Land (SUF, most warehouses) is the other axis that matters: strata buyers hold a title within a shared building; land buyers own the plot outright, which is also why SUF quantum runs so much higher per transaction.
What's Coming.
Tracked through JTC's own supply pipeline dataset, ranked by gross floor area. JTC names only about 18 of the 113 — for the rest it publishes the works and the street, so the street is the identifier here rather than an invented name. Phases of the same works on the same site are combined into one entry, with the floor area summed.
Never one blended median.
Trailing 12 months
BalanceTenure is one of three columns JTC's own API returns that their own site doesn't display. Nearly a third of recent volume is trading with under 30 years left — and that slice is the only one actually losing value. A single industrial median hides this entirely.
What space actually costs, road by road.
latest complete quarter
Gross rent per square metre per month, as declared to IRAS through e-Stamping. The 25th and 75th percentiles matter as much as the median — a wide spread on one road usually means very different building ages or specifications sitting side by side.
| Road | 25th | Median | 75th |
|---|---|---|---|
| INTERNATIONAL BUSINESS PARK | $44.1 | $49.8 | $56.7 |
| KALLANG WAY | $46.29 | $46.29 | $47.36 |
| BENDEMEER ROAD | $26.36 | $46.01 | $50.6 |
| SCIENCE PARK ROAD | $43.04 | $45.97 | $50.77 |
| SCIENCE PARK DRIVE | $45.2 | $45.2 | $69.84 |
| AYER RAJAH CRESCENT | $42.15 | $44.76 | $47.78 |
| LAVENDER STREET | $43.09 | $44.44 | $45.93 |
| TAI SENG AVENUE | $29.06 | $44.13 | $57.05 |
| CHANGI BUSINESS PARK CENTRAL 2 | $40.36 | $44.06 | $47.53 |
| KIM KEAT ROAD | $37.54 | $42.24 | $44.96 |
| LENG KEE ROAD | $30.67 | $41.97 | $41.98 |
| BOON LEAT TERRACE | $31.82 | $40.57 | $44.11 |
| JALAN KILANG | $38.21 | $39.29 | $40.68 |
| ARUMUGAM ROAD | $31.48 | $38.21 | $38.86 |
| PASIR PANJANG ROAD | $30.44 | $37.67 | $49.51 |
| HOWARD ROAD | $36.52 | $37.0 | $37.19 |
| SIN MING ROAD | $34.1 | $36.95 | $37.38 |
| TOH GUAN ROAD | $30.13 | $36.59 | $38.74 |
| KALLANG AVENUE | $24.35 | $36.4 | $43.3 |
| KAMPONG AMPAT | $32.81 | $36.31 | $39.29 |
| OUTRAM ROAD | $33.49 | $36.1 | $40.41 |
| KAKI BUKIT ROAD 3 | $30.0 | $35.88 | $40.65 |
| TANNERY LANE | $23.32 | $35.85 | $44.87 |
| PAYA LEBAR ROAD | $30.99 | $35.62 | $40.5 |
| HARPER ROAD | $30.81 | $35.47 | $39.97 |
Showing the 25 highest-median roads of 134. Use the filter to find any road in the set.
Source: JTC J-SPACE, from IRAS tenancy declarations. Quarterly — there is no monthly industrial rent figure published at any level of detail.
The split that matters.
QoQ / YoY pre-computed
Source: JTC J-SPACE price and rental indices. The ≤30-year series is JTC's own published cohort index, not a cut we derived.
The things that trip people up.
Industrial has more jargon per square metre than any other segment, and most of it hides a real cost. These are the three that come up most.